Portfolio Net Quarterly Profit
for Past Five Years
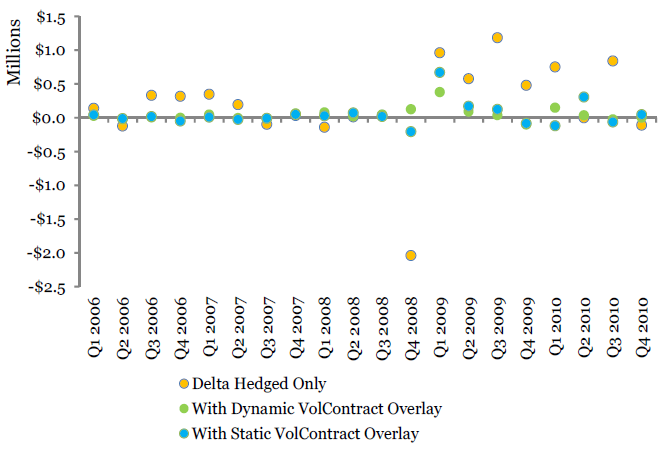
Remarks
The value of a RealVol futures
overlay during an extremely volatile
market period, such as the one studied,
should be expected. But how will the
strategy fare during other, less chaotic,
periods? The chart displayed here
considers a full five years of data, broken
down into 20 consecutive quarters, during
which three-month a RealVol futures (3VOL)
overlay was employed, again, both
dynamically and statically. The results are
impressive.
The net quarterly
profits of the total portfolios are displayed.
Note the considerable dispersion of results
around zero for the delta-hedged-only
options book, compared to the extremely
stable results obtained via the RealVol
futures overlays. Options market-makers should take great solace
in a methodology that could so effectively smooth out the
P&L swings of their books.
|
|
|
©
Copyright 2010-2021 RealVol LLC. All rights reserved
• Site Map
|
|
